Indeed, Palamedes only fits ascending functions. That comes with advantages that we believe weigh heavier than the ability to fit descending data. Especially since there is an easily implemented workaround that allows fitting descending data. You were on the right track when you flipped your x-values. That is more or less the workaround (read on). Couple of other things: There is a syntax error in the code you submitted: the colon between ‘PF’ and ‘Weibull’ should be a comma. The function would have thrown a warning about this. Then, we do not recommend using the ‘Weibull’ with the untransformed stimulus values (regardless of whether your function is ascending or descending). Instead, log-transform your stimulus values and use the ‘Gumbel’ function. It is the equivalent function (see
www.palamedestoolbox.org/weibullandfriends.html) but is much better behaved. For example, the Weibull is only defined for non-negative numbers, while the Gumbel is defined for all real numbers (note that because of the log-transform, the untransformed numbers or ‘raw’ stimulus values will still all be non-negative). The likelihood and posterior functions across threshold values will also be much more symmetrical when using log-transformed values with the Gumbel instead of untransformed values with the Weibull.
We also suspect that the Weibull (or the Gumbel) is not the appropriate choice for your data. For one, a stimulus value of 0 is special for a Weibull, i.e., PAL_Weibull([threshold slope 0 0],0) will always evaluate to 0 (regardless of the value of threshold or slope). That makes sense if your intensity values correspond to the luminance contrast of your stimulus in some 2AFC task, for example, because if your stimulus has contrast equal to zero, then there is no stimulus. But in your data, a stimulus value of 0 leads to high performance. It makes my brain hurt to think about what it means to fit a descending Weibull given this issue. If your choice for Weibull was motivated solely by a log-transform being appropriate for your data (and did not take into account that a stimulus value of 0 is special for a Weibull) then I would reconsider your choice. Instead just log-transform your data and pick a psychometric function for which 0 is just another number (e.g., logistic, cumulative normal).
Also, by default, PAL_PFHB_fitModel will fix the lower asymptote (‘guess rate’) at 0.5. This appears to be inappropriate for your data. Pardon the insertion of a ‘frequentist’ argument here, but your proportions of trials resulting in a ‘positive’ response dip ‘significantly’ below 0.5.
So, all in all, we suggest this:
data.x = [24, 16, 8, 4, 2, 1, 0.5, 0]; % Stimulus rotation
data.y = [134, 140, 208, 324, 338, 334, 326, 346];
data.n = [384, 384, 384, 384, 384, 384, 384, 384];
data.x = log10(data.x); %use log-transformed stimulus values
data.x = -1*data.x; %flip your x-values
pfhb = PAL_PFHB_fitModel(data, 'PF', 'gumbel','g','constrained') %fit using gumbel and free the guess rate (but also consider using e.g., logistic)
PAL_PFHB_inspectFit(pfhb) then gives this:
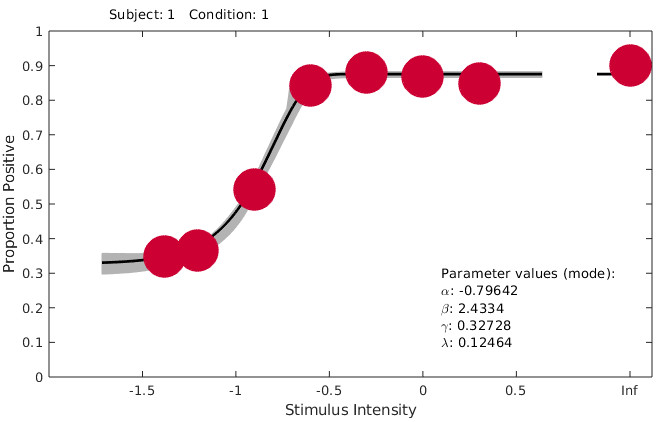
Note that the stimulus values here are given as the log-transformed and 'flipped' versions of your raw data. Note that the reported values for alpha (‘threshold’) are also inverted and log-transformed. So, Palamedes reports alpha as -0.79352, but this would correspond to a ‘raw’ stimulus intensity of 10^(-1*-0.79642)= 6.2578.
and PAL_PFHB_drawViolins(pfhb) gives this:
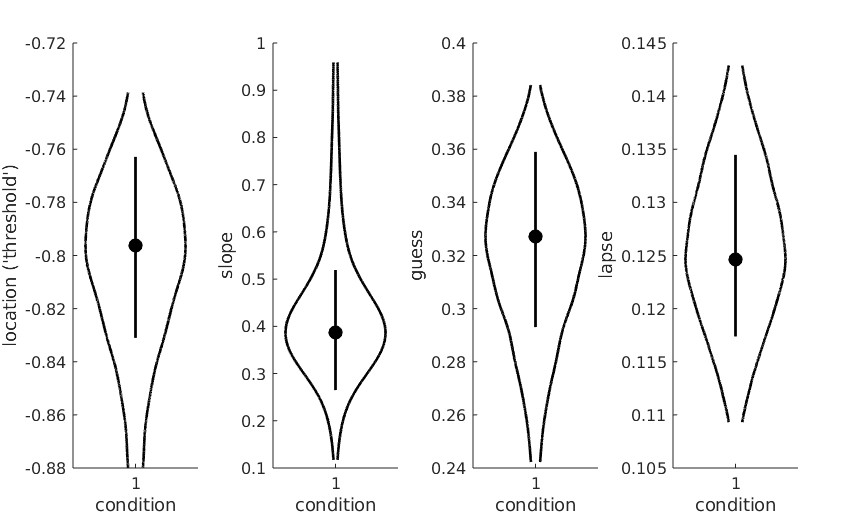
The violin plot for alpha values of course also shows the log-transformed and flipped values for intensity.