
Hierarchical Bayesian fitting of psychometric functions.
PAL_PFHB_MultipleSubjectsandConditions_Demo: Hierarchical Bayesian fitting of psychometric functions obtained from multiple subjects testing in multiple conditions. Visit our
Bayesian Fitting page for more information
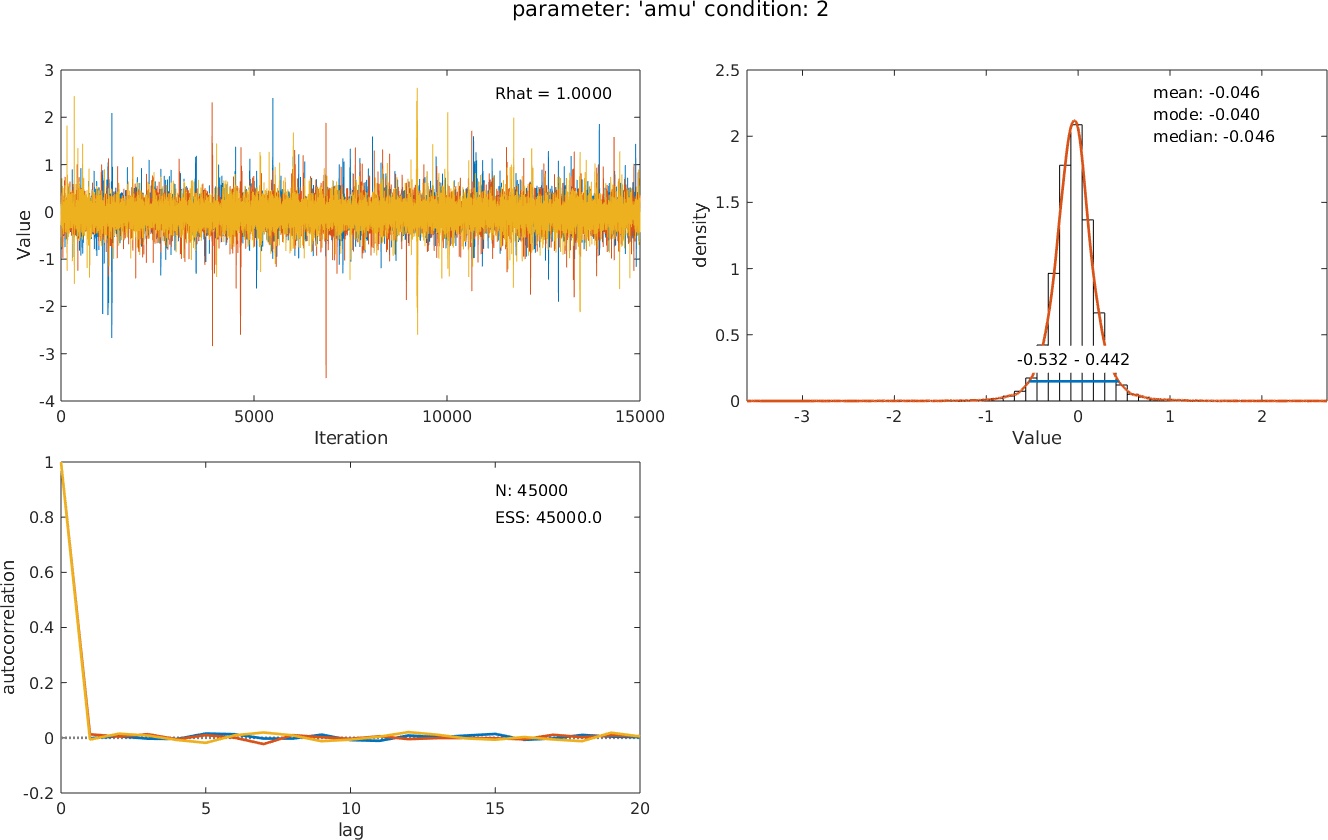
Figure 1. Posterior and diagnostic plots for the location hyper parameter in condition 2.
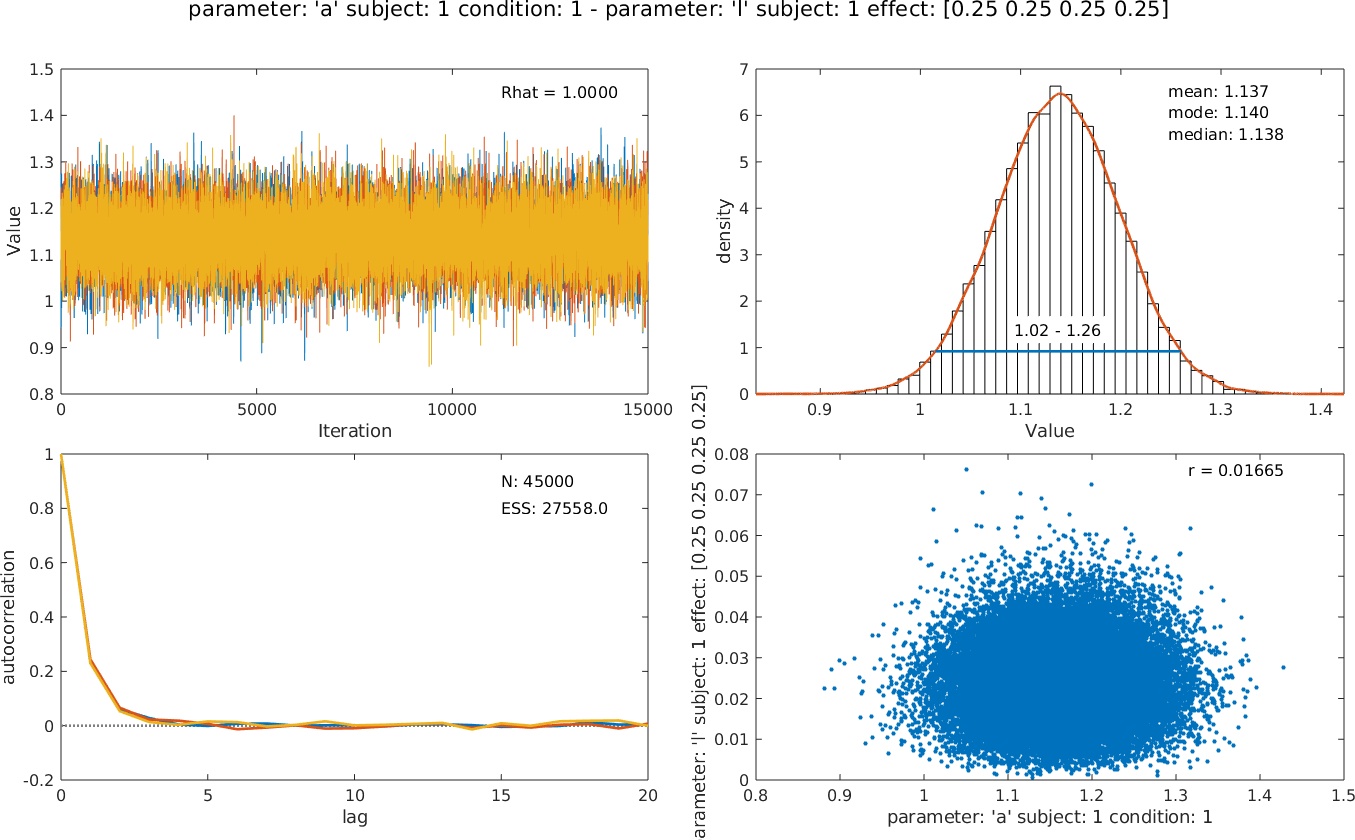
Figure 2. Posterior for the difference between the location parameter of subject 1 in condition 1 and the lapse rate parameter of subject 1. The bottom right graph shows a scatterplot between these two parameters and the correlation coefficient. Parameters that show a high correlation can be problematic.
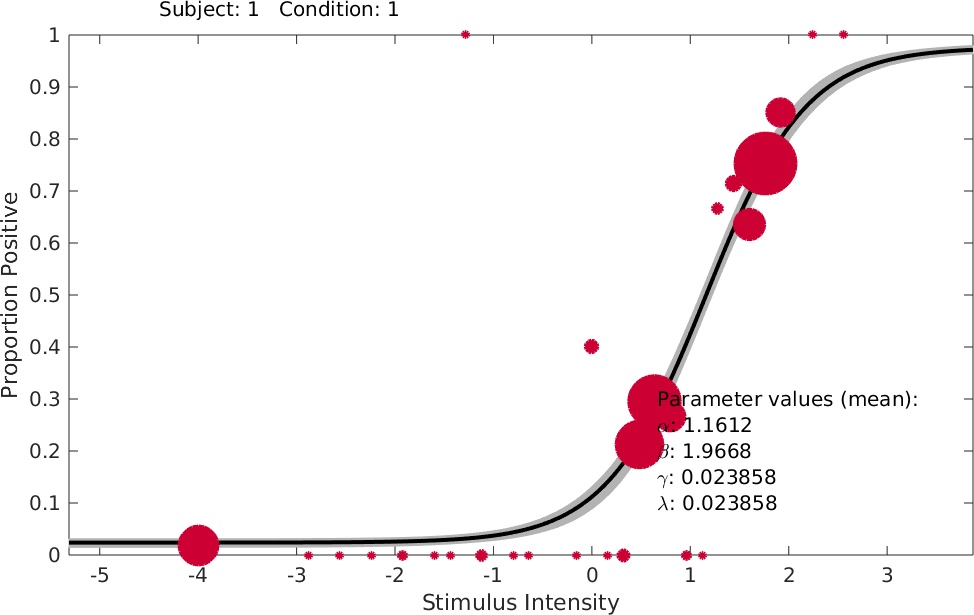
Figure 3. Data and fit for subject 1 in condition 1.
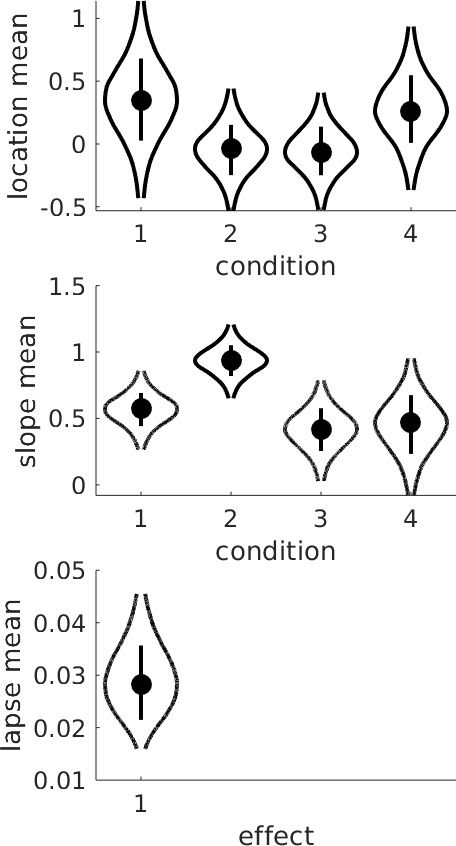
Figure 4. Violin plot for hyper-parameters. Note that by default one lapse rate is estimated per subjects, effectively assuming that lapse rates do not differ between conditions (but may differ between subjects).
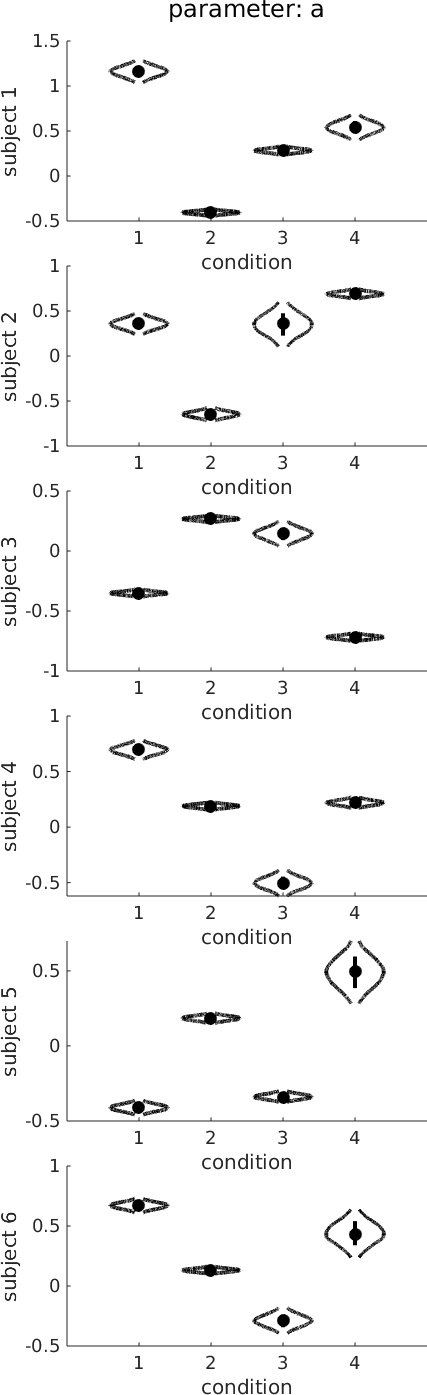
Figure 5. Violin plot for all individual location parameters.
Figure 1. Posterior and diagnostic plots for the location hyper parameter in condition 2.
Figure 2. Posterior for the difference between the location parameter of subject 1 in condition 1 and the lapse rate parameter of subject 1. The bottom right graph shows a scatterplot between these two parameters and the correlation coefficient. Parameters that show a high correlation can be problematic.
Figure 3. Data and fit for subject 1 in condition 1.
Figure 4. Violin plot for hyper-parameters. Note that by default one lapse rate is estimated per subjects, effectively assuming that lapse rates do not differ between conditions (but may differ between subjects).
Figure 5. Violin plot for all individual location parameters.