Simple single-condition Bayesian fit of psychometric function
Palamedes can fit multiple conditions and multiple observers simultaneously while giving considerable flexibility to specify models, but let's start with fitting a single PF.
Palamedes calls on either JAGS (Plummer, 2003) or STAN (Stan Development Team, 2018) to sample the posterior so you must install either of them first.
Fitting a single psychometric function using PAL_PFHB_fitModel with default settings is as simple as:
>> data.x = [-0.6547 -0.1406 0.3736 0.8878 1.4019 1.9161 2.4303 2.9444 6.9068];
>> data.y = [3 34 30 33 9 6 2 15 65];
>> data.n = [6 56 39 37 12 7 3 15 65];
>> pfhb = PAL_PFHB_fitModel(data);
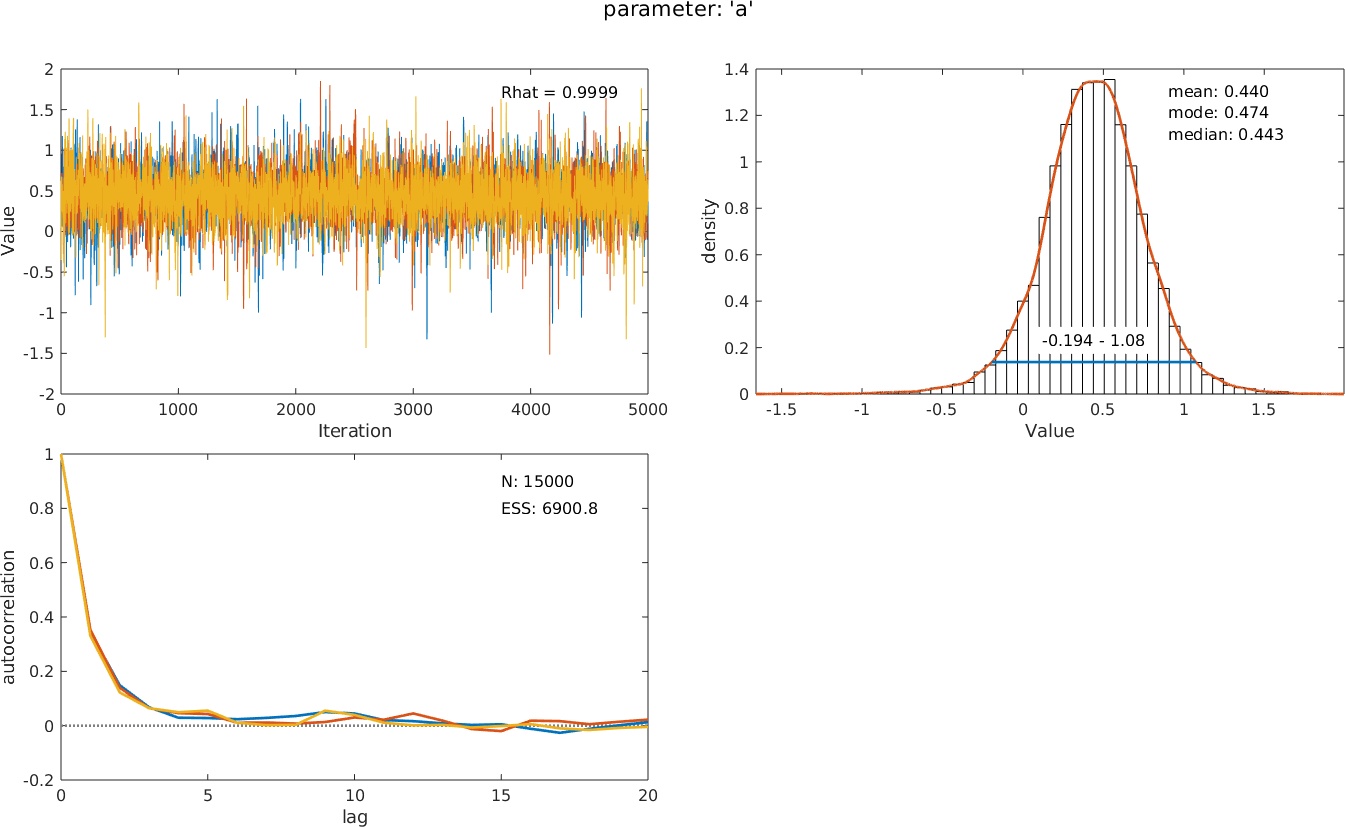
Of course, you can change the default settings (e.g., change the value of the guess rate or estimate it, change priors, etc.). The resulting structure pfhb contains a wealth of information: summary statistics, diagnostic information, and much more. Palamedes can visualize this information for you: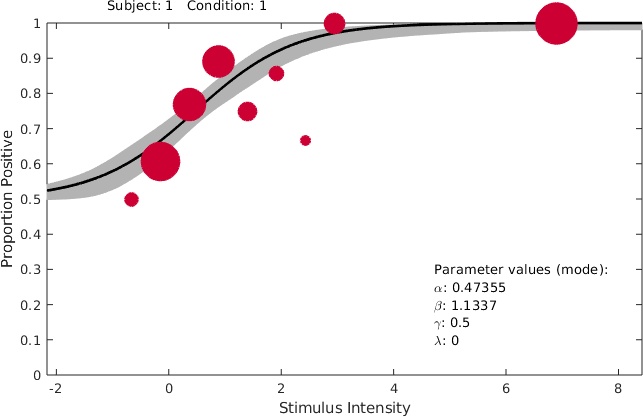 >> PAL_PFHB_inspectParam(pfhb)creates a graph of the posterior distribution of any of the free parameters (by default the
location or 'threshold') parameter alongside some diagnostic graphs:
>> PAL_PFHB_inspectParam(pfhb)creates a graph of the posterior distribution of any of the free parameters (by default the
location or 'threshold') parameter alongside some diagnostic graphs:
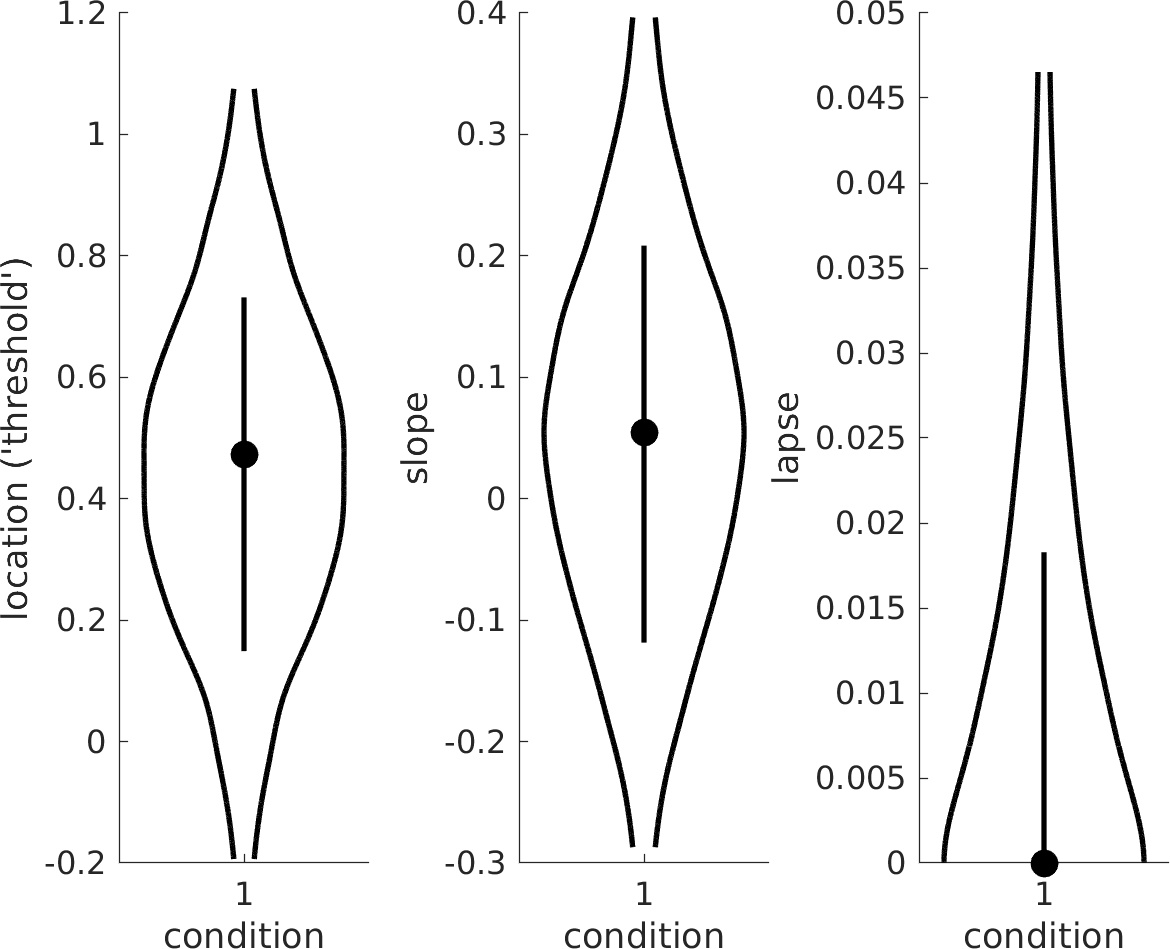
 >> PAL_PFHB_drawViolins(pfhb)creates a violin plot of the parameters of interest:
>> data.y = [3 34 30 33 9 6 2 15 65];
>> data.n = [6 56 39 37 12 7 3 15 65];
>> pfhb = PAL_PFHB_fitModel(data);
Of course, you can change the default settings (e.g., change the value of the guess rate or estimate it, change priors, etc.). The resulting structure pfhb contains a wealth of information: summary statistics, diagnostic information, and much more. Palamedes can visualize this information for you:
>> PAL_PFHB_inspectFit(pfhb)
creates a Figure of the data and fitted function:
>> PAL_PFHB_inspectParam(pfhb)creates a graph of the posterior distribution of any of the free parameters (by default the
location or 'threshold') parameter alongside some diagnostic graphs:
>> PAL_PFHB_drawViolins(pfhb)creates a violin plot of the parameters of interest:
Multiple conditions
If you wish to fit multiple conditions simultaneously just add the data and a new field .c to the data structure that contains the condition number. The default for Palamedes will be to fit a PF to each condition while allowing the location parameters (
aka 'thresholds') and slope parameters to differ between the conditions but to constrain the lapse rates to be equal between the conditions. Since lapses by definition occur independently of the stimuli
this is a sensible constraint that improves estimates and convergence (Prins, Behavior Research Methods, 2024 ).
>> data.x = [-4 -3 -2 -1 0 1 2 3 4 -4 -3 -2 -1 0 1 2 3 4 -4 -3 -2 -1 0 1 2 3 4];
>> data.y = [4 5 11 27 45 79 86 91 97 7 2 19 28 39 66 93 94 98 3 2 14 29 50 75 91 91 98];
>> data.n = 100*ones(size(data.x));
>> data.c = [1 1 1 1 1 1 1 1 1 2 2 2 2 2 2 2 2 2 3 3 3 3 3 3 3 3 3] ;
>> pfhb = PAL_PFHB_fitModel(data, 'gammaEQlambda', true);
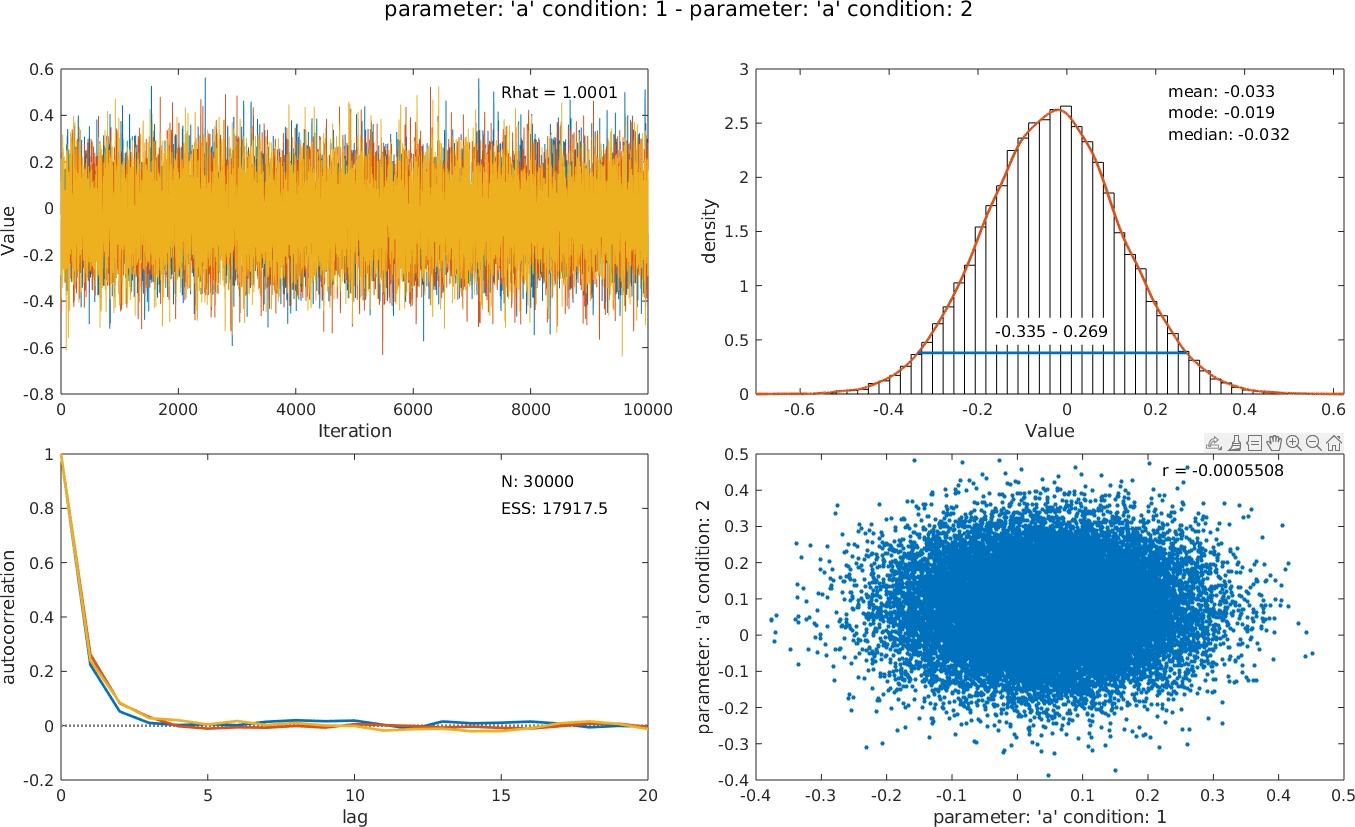
>> PAL_PFHB_inspectParam(pfhb, 'a', 'condition', 1, 'a', 'condition', 2);
 More elaborate comparisons (e.g., does the location parameter in condition 3 differ from the average of the location parameters in conditions 1 and 2?) can be accomplished by running the
analysis using a model matrix containing contrasts. See PAL_PFHB_SingleSubjectMultipleConditions_Demo.
More elaborate comparisons (e.g., does the location parameter in condition 3 differ from the average of the location parameters in conditions 1 and 2?) can be accomplished by running the
analysis using a model matrix containing contrasts. See PAL_PFHB_SingleSubjectMultipleConditions_Demo.
>> data.y = [4 5 11 27 45 79 86 91 97 7 2 19 28 39 66 93 94 98 3 2 14 29 50 75 91 91 98];
>> data.n = 100*ones(size(data.x));
>> data.c = [1 1 1 1 1 1 1 1 1 2 2 2 2 2 2 2 2 2 3 3 3 3 3 3 3 3 3] ;
>> pfhb = PAL_PFHB_fitModel(data, 'gammaEQlambda', true);
Note that these are simulated data from an appearance-based task (e.g., left/right in Vernier alignment) in which the lower-asymptote of the PF corresponds to the lapse rate also.
PAL_PFHB_inspectParam can still show posteriors for individual parameters, but can also be used to create posteriors for differences between parameters. E.g., want to know whether the location parameter differs between conditions 1 and 2? Use:>> PAL_PFHB_inspectParam(pfhb, 'a', 'condition', 1, 'a', 'condition', 2);
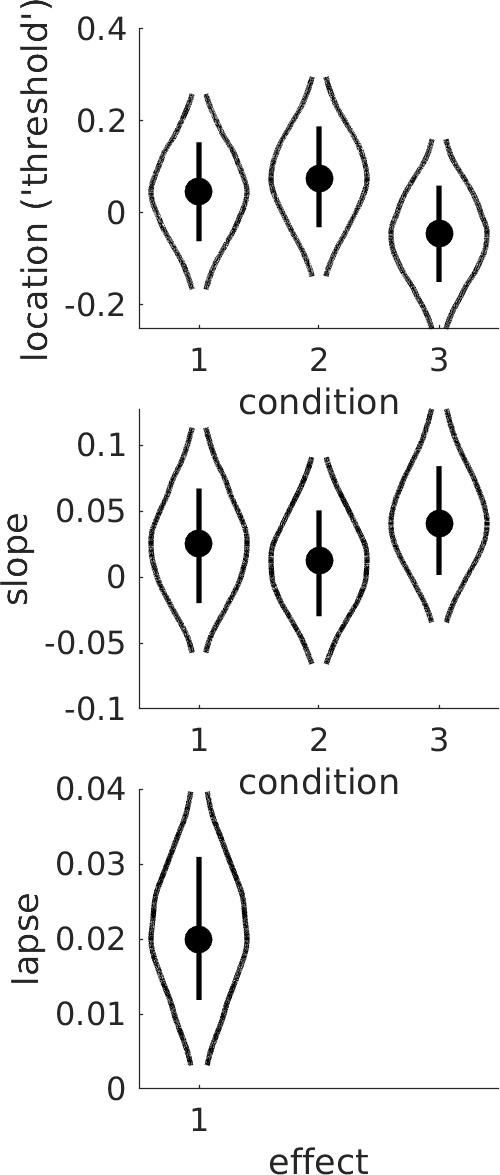
The same question can also be assessed by inspection of the violin plot:
>> PAL_PFHB_drawViolins(pfhb)
More elaborate comparisons (e.g., does the location parameter in condition 3 differ from the average of the location parameters in conditions 1 and 2?) can be accomplished by running the
analysis using a model matrix containing contrasts. See PAL_PFHB_SingleSubjectMultipleConditions_Demo.
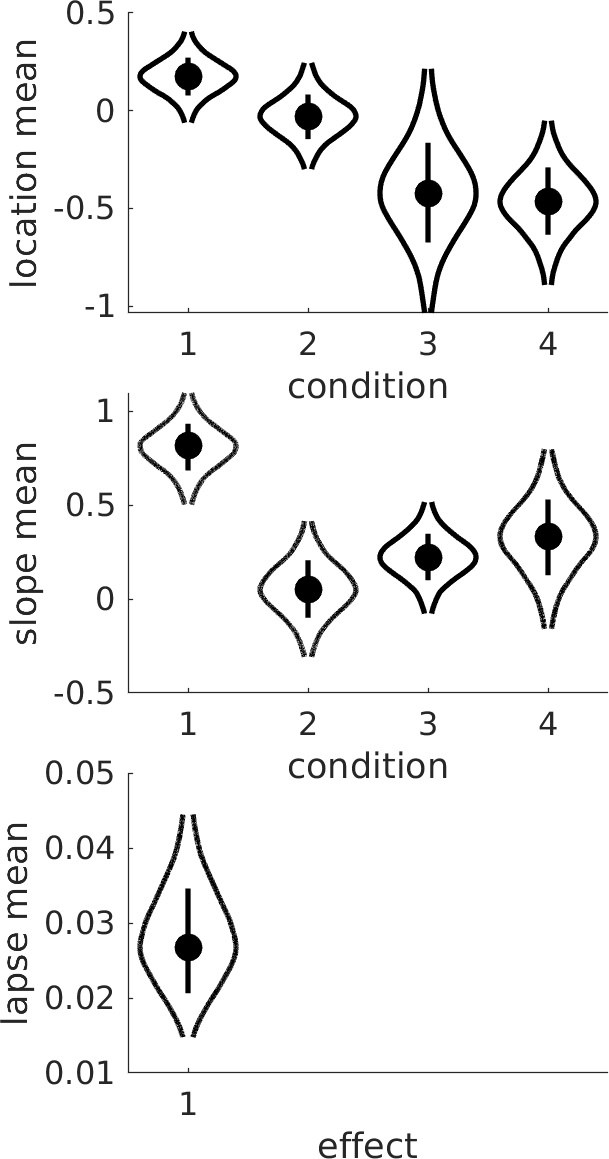
Multiple observers
Multiple observers can be included by adding a new field .s that contains the subject numbers (must be consecutive starting at 1) to the data structure. Palamedes will then fit a hierarchical model that includes hyperparameters
that summarize how the individual-level parameters are distributed among the observers. PAL_PFHB_drawViolins will plot the hyperparameters by default (e.g., the mean of location parameters ('thresholds')
across observers), or can plot any of the individual-level parameters across conditions and subjects.
Schematic of Full Model
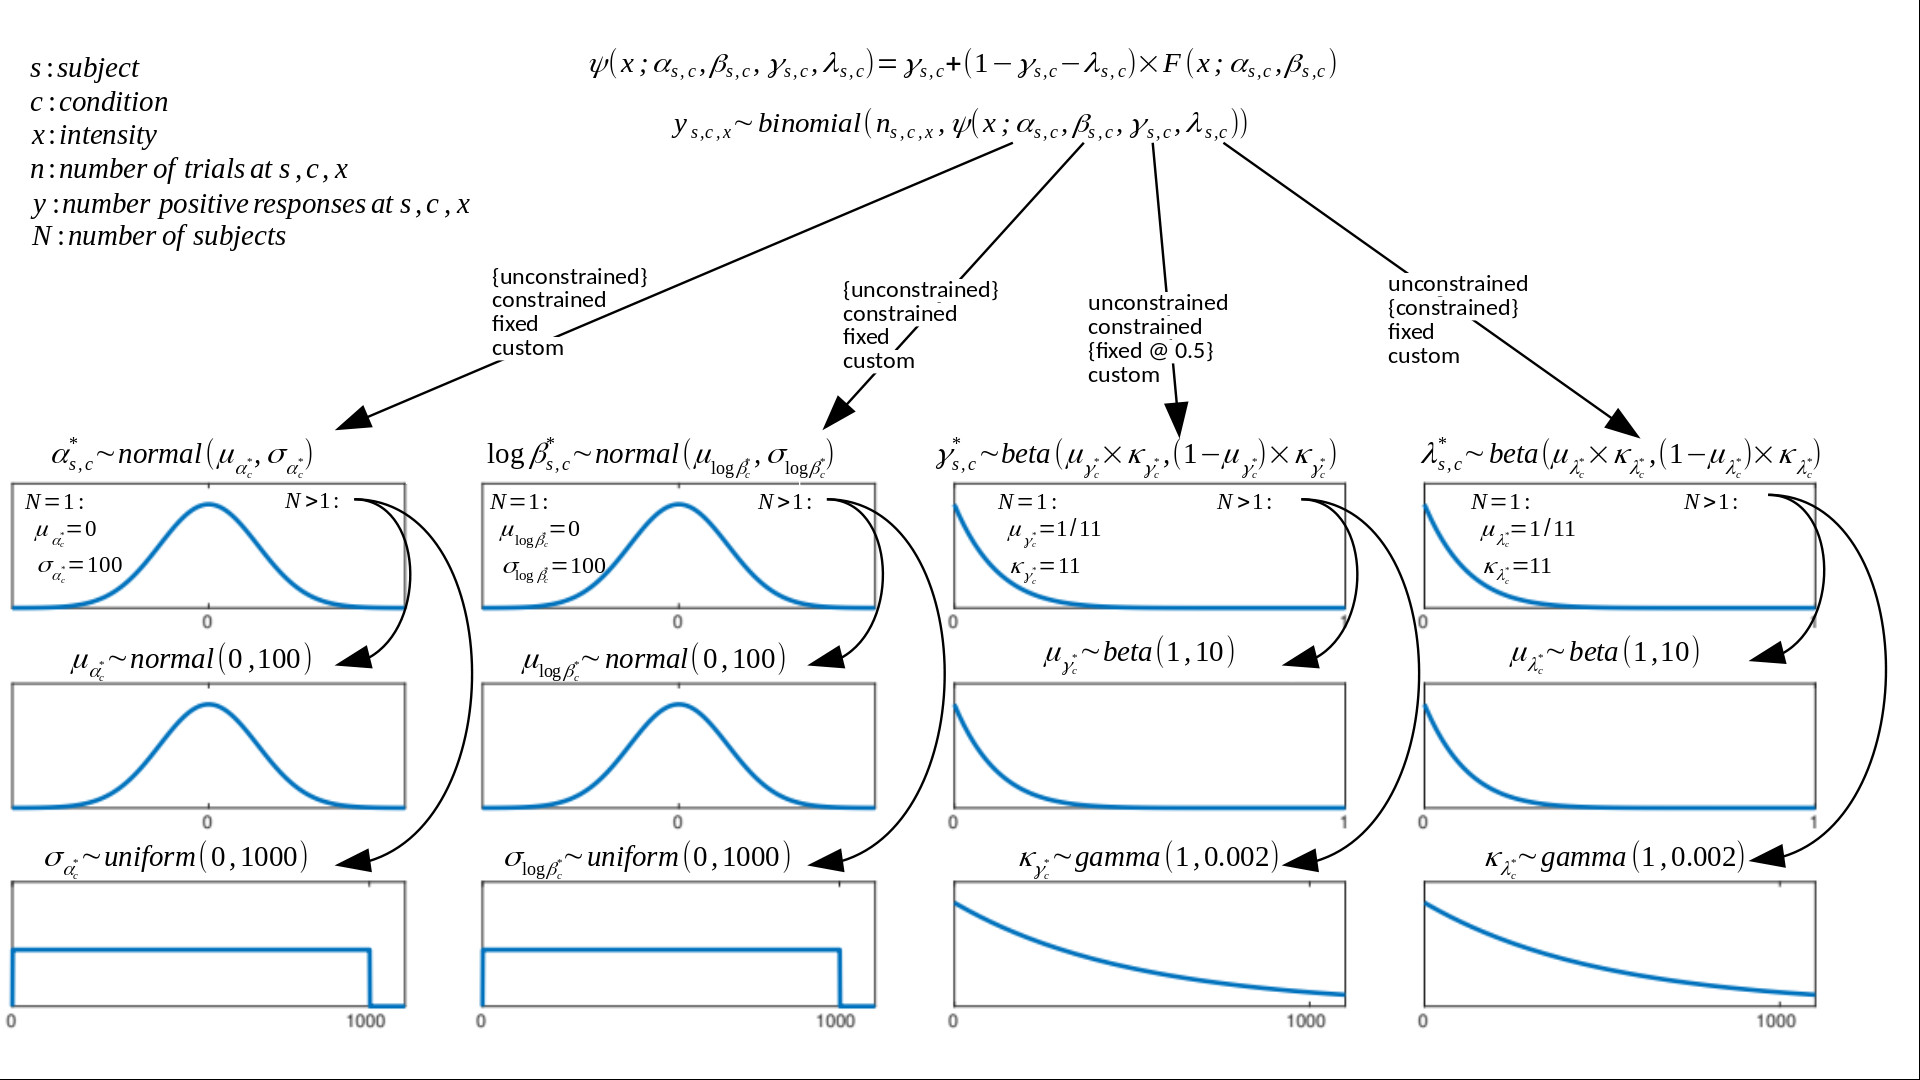 Default model fitted by PAL_PFHB_fitModel. Note that starting with version 1.11.12, Palamedes finds apt, but not particularly informative, priors for the location and slope parameters based on the
stimulus placement used in the experiment.
See our 'guided priors' page for more information.
Forms and parameters of prior functions may be adjusted. Default form of F(x; α, β, γ, λ) is the Logistic function. Any of the PF
parameters (location λ, slope β, guess rate γ, lapse rate λ) may be independently constrained between multiple conditions in experiment. Options: 'unconstrained' (parameter free to vary in each
condition), 'constrained' (parameter is constrained to be equal between conditions), 'fixed' (parameter is fixed at some value). The default constraints on parameters are indicated in figure using curly brackets. Parameters may also be constrained in some custom manner through
the use of a model matrix on condition. This allows one, for example, to specify parameters corresponding to 'effects'. A simple example of this is given in the file
PAL_PFHB_SingleSubjectMultipleConditions_Demo.m in the PalamedesDemos folder. A more elaborate example that demonstrates the flexibility with which the user can specify effects is given here:
Prins, Behavior Research Methods, 2024. An early version of this paper with additional alternative analyses and corresponding code is here:
pre-review version at OSF with code. Learn how to a create model matrices to target specific researh questions on our Model Matrix page.
Default model fitted by PAL_PFHB_fitModel. Note that starting with version 1.11.12, Palamedes finds apt, but not particularly informative, priors for the location and slope parameters based on the
stimulus placement used in the experiment.
See our 'guided priors' page for more information.
Forms and parameters of prior functions may be adjusted. Default form of F(x; α, β, γ, λ) is the Logistic function. Any of the PF
parameters (location λ, slope β, guess rate γ, lapse rate λ) may be independently constrained between multiple conditions in experiment. Options: 'unconstrained' (parameter free to vary in each
condition), 'constrained' (parameter is constrained to be equal between conditions), 'fixed' (parameter is fixed at some value). The default constraints on parameters are indicated in figure using curly brackets. Parameters may also be constrained in some custom manner through
the use of a model matrix on condition. This allows one, for example, to specify parameters corresponding to 'effects'. A simple example of this is given in the file
PAL_PFHB_SingleSubjectMultipleConditions_Demo.m in the PalamedesDemos folder. A more elaborate example that demonstrates the flexibility with which the user can specify effects is given here:
Prins, Behavior Research Methods, 2024. An early version of this paper with additional alternative analyses and corresponding code is here:
pre-review version at OSF with code. Learn how to a create model matrices to target specific researh questions on our Model Matrix page.