
Likelihood ratio test: Trend analysis on four conditions
PAL_PFLR_FourGroup_Demo: The nature of the relationship among the location parameters ('thresholds') in four conditions of an experiment is investigated via 'trend analysis' using a traditional likelihood ratio tests. See Prins & Kingdom (2018).. For a Bayesian approach to this same experiment, see our Bayesian Fitting page
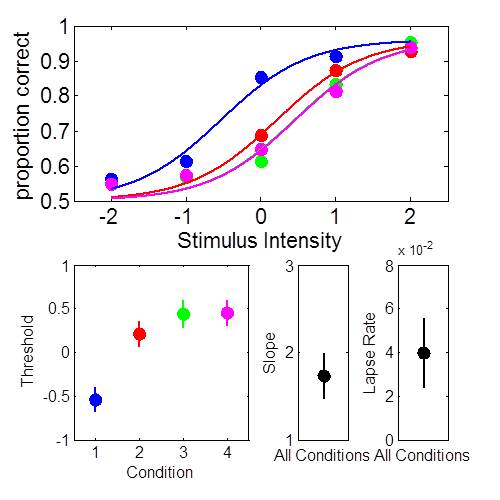
Figure 1. Four conditions fitted with individual thresholds, common (but fitted) slope and lapse rate (guess rate fixed at 0.5). This is a 6 parameter (4 thresholds, 1 slope, 1 lapse rate) model.

Figure 2. Model comparison. Model shown in Figure 1 (4 thresholds, 1 slope, 1 lapse rate) versus model with shared threshold (1 threshold, 1 slope, 1 lapse rate). I.e., are thresholds differences 'statistically reliable'?
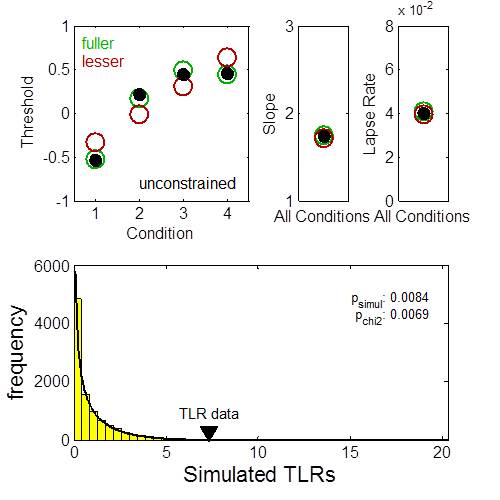
Figure 3. Model comparison: Quadratic trend on thresholds versus linear trend on thresholds. I.e., is bend in threshold plot statistically reliable?
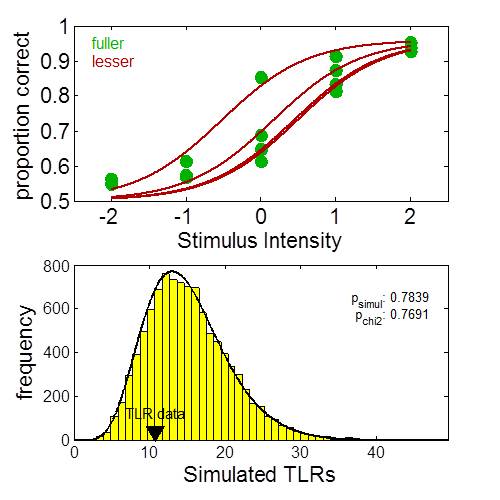
Figure 4. Goodness-of-Fit: Quadratic trend on threshold, common slope, common lapse rate, logistic form versus saturated model.
Figure 1. Four conditions fitted with individual thresholds, common (but fitted) slope and lapse rate (guess rate fixed at 0.5). This is a 6 parameter (4 thresholds, 1 slope, 1 lapse rate) model.
Figure 2. Model comparison. Model shown in Figure 1 (4 thresholds, 1 slope, 1 lapse rate) versus model with shared threshold (1 threshold, 1 slope, 1 lapse rate). I.e., are thresholds differences 'statistically reliable'?
Figure 3. Model comparison: Quadratic trend on thresholds versus linear trend on thresholds. I.e., is bend in threshold plot statistically reliable?
Figure 4. Goodness-of-Fit: Quadratic trend on threshold, common slope, common lapse rate, logistic form versus saturated model.