Scaling for Stim Levels
Scaling for Stim Levels
Hi. I am new to Palamedes. I was trying to fit my data using the PAL_PFML function. However, I am facing a problem with the scaling of stimulus levels. If I have to put my actual stimulus level, which is in the range of 300-700, it shows the error that the fit to simulation did not converge. Can someone please help how I would go about it? Note that when I convert the values into decimals, the fit comes well. However, the output parameters, especially the slope values are a bit misleading.
-
Nick Prins

- Site Admin
- Posts: 30
- Joined: Sun Feb 13, 2022 8:55 pm
Re: Scaling for Stim Levels
Hi. can you submit your code (including data)? I can take a look.
Nick Prins, Administrator
Re: Scaling for Stim Levels
Hi. Thanks for the quick response. I used the code PAL_PFML_Demo.
Here is my data.
0 1 5 24 30 30 30
1 6 13 19 24 22 27
3 7 6 17 14 23 26
1 0 6 12 18 23 23
3 8 9 18 23 24 29
5 7 12 17 20 23 21
0 2 5 13 13 23 22
0 8 8 13 17 18 24
0 3 11 22 28 27 30
11 6 18 23 20 28 27
1 3 6 17 25 27 28
0 0 4 13 21 23 27
0 2 8 16 21 22 29
1 7 8 13 21 20 25
0 8 13 20 24 29 29
8 10 13 18 23 26 24
6 9 12 22 27 26 27
3 9 9 13 20 20 22
4 5 10 17 23 22 24
0 7 16 25 27 27 29
0 1 7 11 23 24 30
0 3 10 25 29 27 29
0 3 6 16 24 26 30
3 2 5 12 20 23 25
1 4 13 23 27 27 30
1 1 11 23 24 29 30
1 3 12 14 27 21 25
4 15 21 22 25 24 28
5 14 11 12 23 24 25
3 10 12 21 24 26 25
5 3 13 9 13 10 19
2 5 16 21 29 27 28
1 4 10 16 22 28 30
1 10 8 27 27 28 29
0 4 8 20 28 29 30
And here is the code I used -
%PAL_PFML_Demo Demonstrates use of Palamedes functions to (1) fit a
%Psychometric Function to some data using a Maximum Likelihood criterion,
%(2) determine standard errors of free parameters using a bootstrap
%procedure and (3) determine the goodness-of-fit of the fit.
%
%Demonstrates basic usage of Palamedes functions:
%-PAL_PFML_Fit
%-PAL_PFML_BootstrapParametric
%-PAL_PFML_BootstrapNonParametric
%-PAL_PFML_GoodnessOfFit
%secondary:
%-PAL_Logistic
%
%More information on any of these functions may be found by typing
%help followed by the name of the function. e.g., help PAL_PFML_Fit
%
%NP (08/23/2009)
clear all; %Clear all existing variables from memory
tic
for i=1:1:35
%message = 'Parametric Bootstrap (1) or Non-Parametric Bootstrap? (2): ';
ParOrNonPar =1;% input(message);
Data=xlsread("Book1.xlsx");
%Stimulus intensities
StimLevels = [320 380 440 500 560 620 680];
%Number of positive responses (e.g., 'yes' or 'correct' at each of the
% entries of 'StimLevels'
NumPos = Data(i,:);
%Number of trials at each entry of 'StimLevels'
OutOfNum = [30 30 30 30 30 30 30];
%Use the Logistic function
PF = @PAL_Logistic; %Alternatives: PAL_Gumbel, PAL_Weibull,
%PAL_Quick, PAL_logQuick,
%PAL_CumulativeNormal, PAL_HyperbolicSecant
%Threshold and Slope are free parameters, guess and lapse rate are fixed
paramsFree = [1 1 0 0]; %1: free parameter, 0: fixed parameter
%Parameter grid defining parameter space through which to perform a
%brute-force search for values to be used as initial guesses in iterative
%parameter search.
searchGrid.alpha = 0.01:.001:.11;
searchGrid.beta = logspace(0,3,101);
searchGrid.gamma = 0; %scalar here (since fixed) but may be vector
searchGrid.lambda = 0.1; %ditto
%Perform fit
disp('Fitting function.....');
[paramsValues LL exitflag] = PAL_PFML_Fit(StimLevels,NumPos, ...
OutOfNum,searchGrid,paramsFree,PF);
disp('done:')
message = sprintf('Threshold estimate: %6.4f',paramsValues(1));
disp(message);
message = sprintf('Slope estimate: %6.4f\r',paramsValues(2));
disp(message);
%Number of simulations to perform to determine standard error
B=400;
disp('Determining standard errors.....');
if ParOrNonPar == 1
[SD paramsSim LLSim converged] = PAL_PFML_BootstrapParametric(...
StimLevels, OutOfNum, paramsValues, paramsFree, B, PF, ...
'searchGrid', searchGrid);
else
[SD paramsSim LLSim converged] = PAL_PFML_BootstrapNonParametric(...
StimLevels, NumPos, OutOfNum, [], paramsFree, B, PF,...
'searchGrid',searchGrid);
end
disp('done:');
message = sprintf('Standard error of Threshold: %6.4f',SD(1));
disp(message);
message = sprintf('Standard error of Slope: %6.4f\r',SD(2));
disp(message);
%Distribution of estimated slope parameters for simulations will be skewed
%(type: hist(paramsSim(:,2),40) to see this). However, distribution of
%log-transformed slope estimates will be approximately symmetric
%[type: hist(log10(paramsSim(:,2),40)]. This might motivate using
%log-scale for slope values (uncomment next three lines to put on screen):
% SElog10slope = std(log10(paramsSim(:,2)));
% message = ['Estimate for log10(slope): ' num2str(log10(paramsValues(2))) ' +/- ' num2str(SElog10slope)];
% disp(message);
%Number of simulations to perform to determine Goodness-of-Fit
B=1000;
disp('Determining Goodness-of-fit.....');
[Dev pDev] = PAL_PFML_GoodnessOfFit(StimLevels, NumPos, OutOfNum, ...
paramsValues, paramsFree, B, PF, 'searchGrid', searchGrid);
disp('done:');
%Put summary of results on screen
message = sprintf('Deviance: %6.4f',Dev);
disp(message);
message = sprintf('p-value: %6.4f',pDev);
disp(message);
%Create simple plot
ProportionCorrectObserved=NumPos./OutOfNum;
StimLevelsFineGrain=[min(StimLevels):max(StimLevels)./1000:max(StimLevels)];
ProportionCorrectModel = PF(paramsValues,StimLevelsFineGrain);
figure('name','Maximum Likelihood Psychometric Function Fitting');
axes
hold on
plot(StimLevelsFineGrain*10000,ProportionCorrectModel,'-','color',[0 .7 0],'linewidth',4);
plot(StimLevels*10000,ProportionCorrectObserved,'k.','markersize',40);
set(gca, 'fontsize',16);
set(gca, 'Xtick',StimLevels);
axis([min(StimLevels)*10000 max(StimLevels)*10000 0 1]);
xlabel('Stimulus Intensity');
ylabel('proportion correct');
params_values_all_part(i,1:4)=paramsValues;
dev_p_val(i,1:2)=[Dev pDev];
end
toc
-
Nick Prins
- Site Admin
- Posts: 30
- Joined: Sun Feb 13, 2022 8:55 pm
Re: Scaling for Stim Levels
The main issue is that the searchGrid was not appropriate. See here for more information on what searchGrid is: https://www.palamedestoolbox.org/unders ... tting.html
You should also rethink setting searchGrid.gamma = 0 and searchGrid.lambda = 0.1. I don't know what your task is but based on your data it would seem more appropriate to set both to the same number (and probably lower than 0.1 (maybe 0.03?)).
The code below fits functions to all 35 data sets fine but some of the bootstrap simulations fail to converge (note that this is not because Palamedes fails to find an existing maximum in the likelihood function but, instead, because no maximum exists in the likelihood function). See here for more information: https://www.palamedestoolbox.org/unders ... tting.html (most, if not all failed fits are what we refer to as 'scenario -1' on that page).
Your first data set (subject 1?) is one example. Data and fit look like this:
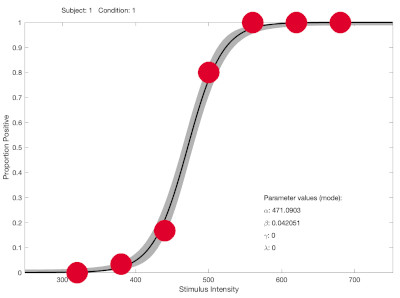
Note that there are just a few stimulus intensities in the dynamic range of the function (while most intensities are at asymptotic levels and provide little information on location ('threshold') or slope). As a result, in some bootstrap simulations there might only be observed proportions near 0 and 1 and the best fitting function might be one with an infinitely steep slope (again, see the 'understanding fitting' page on palamedestoolbox.org).
A good way to avoid this issue is to use an adaptive testing method that targets both location and slope (e.g., the Psi method).
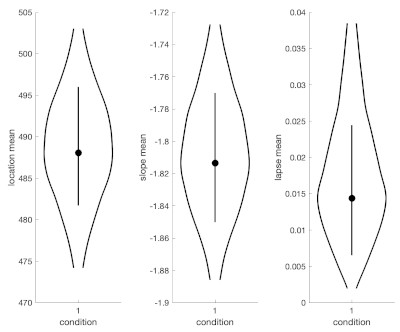
That won't save your existing data of course, but a Bayesian fit gets around the failed fit issue in an elegant manner (more information of Bayesian fits here: https://www.palamedestoolbox.org/hierar ... esian.html). And as a bonus in Palamedes, you can get pictures like the one above and the one below after performing a Bayesian fit. See code below. (the warning PAL_PFHB_fitModel might throw is inconsequential).
You should also rethink setting searchGrid.gamma = 0 and searchGrid.lambda = 0.1. I don't know what your task is but based on your data it would seem more appropriate to set both to the same number (and probably lower than 0.1 (maybe 0.03?)).
The code below fits functions to all 35 data sets fine but some of the bootstrap simulations fail to converge (note that this is not because Palamedes fails to find an existing maximum in the likelihood function but, instead, because no maximum exists in the likelihood function). See here for more information: https://www.palamedestoolbox.org/unders ... tting.html (most, if not all failed fits are what we refer to as 'scenario -1' on that page).
Your first data set (subject 1?) is one example. Data and fit look like this:
Note that there are just a few stimulus intensities in the dynamic range of the function (while most intensities are at asymptotic levels and provide little information on location ('threshold') or slope). As a result, in some bootstrap simulations there might only be observed proportions near 0 and 1 and the best fitting function might be one with an infinitely steep slope (again, see the 'understanding fitting' page on palamedestoolbox.org).
A good way to avoid this issue is to use an adaptive testing method that targets both location and slope (e.g., the Psi method).
That won't save your existing data of course, but a Bayesian fit gets around the failed fit issue in an elegant manner (more information of Bayesian fits here: https://www.palamedestoolbox.org/hierar ... esian.html). And as a bonus in Palamedes, you can get pictures like the one above and the one below after performing a Bayesian fit. See code below. (the warning PAL_PFHB_fitModel might throw is inconsequential).
Code: Select all
NumPos=xlsread("Book1.xlsx");
StimLevels = [320 380 440 500 560 620 680];
OutOfNum = [30 30 30 30 30 30 30];
PF = @PAL_Logistic;
%Maximum likelihood fit:
paramsFree = [1 1 0 0];
searchGrid.alpha = linspace(320,680,101); %rule of thumb: cover your range of stimulus intensities
searchGrid.beta = logspace(-3,3,101); %covers beta = 0.001 (10^-3) to beta = 1000 (10^3)
searchGrid.gamma = 0.03; %probably makes more sense
searchGrid.lambda = 0.03; %probably makes more sense
for Case = 1:35
[paramsValues LL exitflag] = PAL_PFML_Fit(StimLevels,NumPos(Case,:), ...
OutOfNum,searchGrid,paramsFree,PF)
B = 400;
[SD paramsSim LLSim converged] = PAL_PFML_BootstrapParametric(...
StimLevels, OutOfNum, paramsValues, paramsFree, B, PF, ...
'searchGrid', searchGrid);
[Dev pDev] = PAL_PFML_GoodnessOfFit(StimLevels, NumPos(Case,:), OutOfNum, ...
paramsValues, paramsFree, B, PF, 'searchGrid', searchGrid);
end
%Bayesian fit (requires installing JAGS or cmdStan)
%This fit also estimates lapse rate and assumes 'guess rate' and 'lapse rate' are equal
%(which probably makes sense here
data.x = [];
data.y = [];
data.s = [];
for Case = 1:35
data.x = [data.x StimLevels];
data.y = [data.y NumPos(Case,:)];
data.s = [data.s Case*ones(size(StimLevels))];
end
data.n = 30*ones(size(data.x));
pfhb = PAL_PFHB_fitModel(data,'gammaEQlambda',true,'prior','amu','normal',[500 500],'nsamples',50000); %prior on location
% ('threshold') is close to uniform across stimulus range
PAL_PFHB_inspectFit(pfhb,'all');
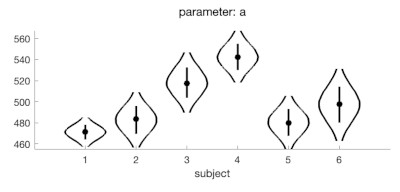
PAL_PFHB_drawViolins(pfhb);
PAL_PFHB_drawViolins(pfhb,'a','subject',[1:6]); Nick Prins, Administrator
Re: Scaling for Stim Levels
Thanks for the very detailed response. I will try this out.